Understanding Google Analytics 4 for Small Business
If you have a business website, you need to understand how people use it. Google Analytics is the most popular tool for this, and Google has introduced a new version called Google Analytics 4, or GA4 for short.
GA4 is quite different from the version you might be used to (Universal Analytics), and Google has announced that Universal Analytics will stop processing data in July 2023. That means now is the time to get familiar with GA4 and make the switch if you have not already.
What Is Google Analytics 4?
Google Analytics 4 is the latest version of Google’s web analytics platform. It tracks how people interact with your website (and app, if you have one) and provides data about your visitors, their behaviour, and your conversions.
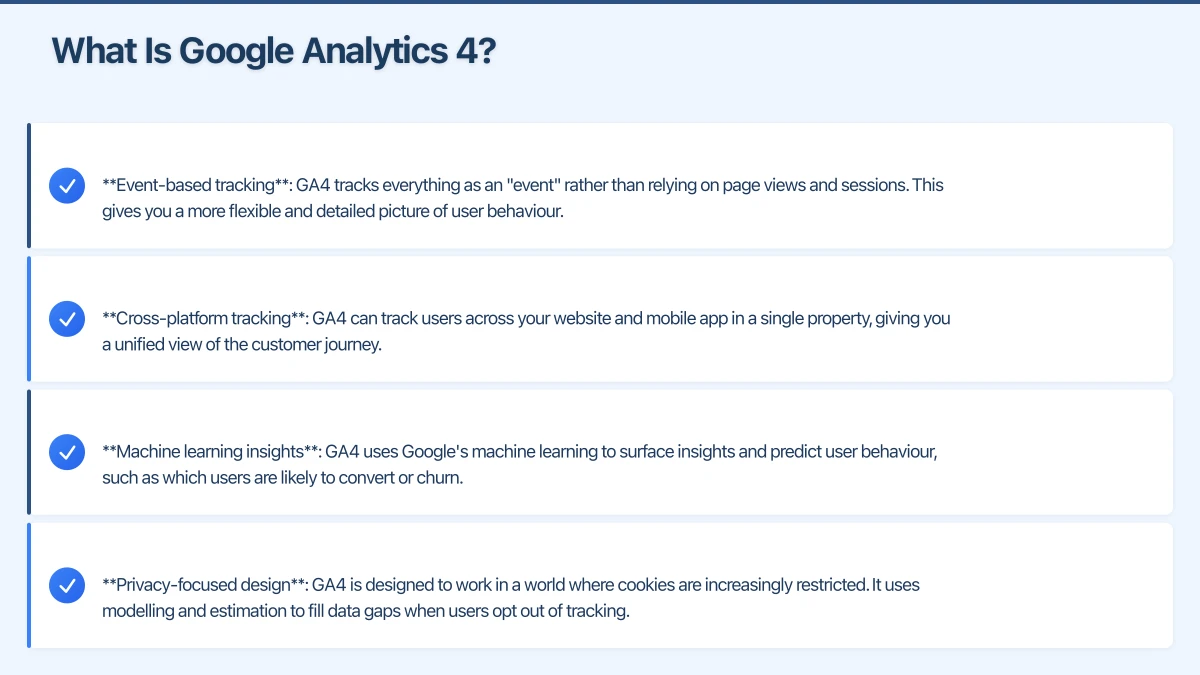
The key differences from Universal Analytics include:
- Event-based tracking: GA4 tracks everything as an “event” rather than relying on page views and sessions. This gives you a more flexible and detailed picture of user behaviour.
- Cross-platform tracking: GA4 can track users across your website and mobile app in a single property, giving you a unified view of the customer journey.
- Machine learning insights: GA4 uses Google’s machine learning to surface insights and predict user behaviour, such as which users are likely to convert or churn.
- Privacy-focused design: GA4 is designed to work in a world where cookies are increasingly restricted. It uses modelling and estimation to fill data gaps when users opt out of tracking.
Why You Need to Switch to GA4
Google has confirmed that Universal Analytics will stop processing new data on 1 July 2023. After that date, you will still be able to access your historical data for a period, but no new data will be collected.
The sooner you set up GA4, the sooner you start collecting data in the new system. GA4 does not import historical data from Universal Analytics, so every day you wait is a day of data you miss.
Our recommendation: set up GA4 now and run it alongside Universal Analytics. That way, you continue to use the familiar Universal Analytics while building up your GA4 data. When Universal Analytics stops working, you will have months of GA4 data to work with.
Setting Up GA4
Step 1: Create a GA4 Property
- Log into your Google Analytics account at analytics.google.com
- Click “Admin” (the gear icon at the bottom left)
- In the Property column, click “Create Property”
- Follow the prompts to set up your new GA4 property
- Enter your business details including your time zone (set this to your Australian time zone) and currency (AUD)
If you already have Universal Analytics set up, you can also use the “GA4 Setup Assistant” found in the Admin section of your Universal Analytics property. This creates a GA4 property connected to your existing one.
Step 2: Add the Tracking Code
GA4 uses a different tracking code than Universal Analytics. You need to add the GA4 tracking code (called a “measurement ID,” starting with “G-”) to your website.
If your website uses:
- WordPress: Install a plugin like Site Kit by Google or insert the code into your theme header
- Shopify: Add the GA4 tag through the Online Store preferences
- Squarespace/Wix: These platforms have built-in fields for Google Analytics tracking codes
If you are not sure how to add the code, your web developer can do it in a few minutes.
Step 3: Configure Basic Settings
Once GA4 is tracking, configure these settings:
- Enhanced Measurement: This is turned on by default and automatically tracks page views, scrolls, outbound clicks, site search, video engagement, and file downloads. Check that it is enabled under Admin, Data Streams, then your web stream.
- Data Retention: By default, GA4 retains event data for 2 months. Change this to 14 months under Admin, Data Settings, Data Retention.
- Google Signals: Enable this to get cross-device reporting and demographics data. Find it under Admin, Data Settings, Data Collection.
Understanding the GA4 Interface
The GA4 interface is quite different from Universal Analytics. Here is a quick tour of the main sections:
Home
The home screen shows a summary of your website’s performance: users, new users, events, and revenue (if applicable). It also surfaces automated insights from Google’s machine learning.
Reports
This is where you will spend most of your time. Reports is divided into:
- Life cycle: Tracks the user journey from acquisition (how they found you) through engagement (what they did on your site) to monetisation (if you sell online) and retention (how often they return)
- User: Demographics and technology information about your visitors
Explore
Explore lets you build custom reports and analyses. It is more powerful but also more complex. For most small businesses, the standard reports provide enough information.
Advertising
If you run Google Ads, this section shows how your ad campaigns perform in terms of conversions on your website.
Key Metrics for Small Business
You do not need to track everything. Focus on these key metrics:
Users and New Users
How many people visit your website, and how many are visiting for the first time? This tells you about your reach and awareness.
Sessions
A session is a group of interactions a user has with your website within a given time frame. More sessions generally means more engagement.
Engagement Rate
This replaces the old “bounce rate” from Universal Analytics (though bounce rate is also available in GA4). Engagement rate is the percentage of sessions that were “engaged,” meaning the user stayed for more than 10 seconds, viewed more than one page, or completed a conversion event.
A higher engagement rate means your content is resonating with visitors.
Average Engagement Time
How long do users actively spend on your website? Longer engagement times suggest people find your content valuable.
Conversions
Conversions are the actions that matter most to your business: form submissions, phone calls, purchases, email sign-ups. Setting up conversion tracking is essential for understanding whether your website is actually driving business results.
Traffic Sources
Where do your visitors come from? The main channels are:
- Organic Search: People who found you through Google or other search engines
- Direct: People who typed your URL directly or used a bookmark
- Social: Visitors from social media platforms
- Referral: Visitors who clicked a link on another website
- Paid Search: Visitors from your Google Ads or other paid advertising
Understanding your traffic sources helps you invest in the channels that work best.
Setting Up Conversions in GA4
In GA4, conversions are based on events. Here is how to set up basic conversions:
Method 1: Mark Existing Events as Conversions
GA4 automatically tracks certain events like page views and clicks. You can mark any event as a conversion. For example, if you create a “thank you” page that appears after a form submission, you can create a custom event for views of that page and mark it as a conversion.
- Go to Configure, then Events
- Click “Create event”
- Set the conditions (for example, event name equals “page_view” and page_location contains “thank-you”)
- Save the event
- Go to Configure, then Conversions, and toggle the event on
Method 2: Use Google Tag Manager
For more complex conversion tracking, Google Tag Manager (GTM) gives you greater flexibility. GTM lets you track form submissions, button clicks, scroll depth, and other interactions without editing your website’s code directly.
If you are not familiar with GTM, it is worth having a web developer set it up for you.
Practical Tips for Small Business Owners
Check Your Analytics Weekly
Set aside 15 to 30 minutes each week to review your website data. Look at:
- Overall traffic trends (up, down, or steady?)
- Which pages are most popular
- Where your traffic comes from
- How many conversions you received
Do Not Get Overwhelmed by Data
GA4 provides enormous amounts of data. Focus on the metrics that relate directly to your business goals. If your goal is lead generation, focus on traffic, engagement, and form submissions. If your goal is online sales, focus on traffic, product views, and purchases.
Compare Time Periods
Always compare your current data to a previous period. “500 users this week” does not mean much on its own. But “500 users this week, up 15 percent from last week” tells you something useful.
Use the Insights Feature
GA4’s automated insights highlight unusual changes or trends in your data. Check these regularly for early warnings about traffic drops or spikes.
What to Do Now
If you have not set up GA4 yet, do it today. The setup process takes about 30 minutes, and the sooner you start, the more historical data you will have when Universal Analytics shuts down next year.
Here is your action list:
- Create a GA4 property in your Google Analytics account
- Add the tracking code to your website
- Configure data retention to 14 months
- Set up your key conversion events
- Start reviewing your GA4 data weekly
If you need help setting up GA4 or understanding your website data, Cosmo Web Tech offers analytics setup and reporting services for Western Sydney businesses. We can get you up and running with GA4 and help you understand what the data means for your business.
Your website’s performance depends on what’s behind it. Cloud Geeks provides the managed hosting, cloud, and IT support that keeps Australian SMBs online and secure.
Ash Ganda covers how Australian SMBs are using AI, automation, and digital strategy to grow without scaling costs proportionally.
If your business is also planning a customer-facing iOS or Android app — Awesome Apps builds cross-platform mobile apps for Australian SMBs.
Part of the Ganda Tech Services family, Cosmos Web Tech delivers specialist web design and digital marketing for Australian small and medium businesses.