Your website gets visitors every day. But do you know who they are, where they come from, or what they do on your site? For most Western Sydney small business owners, their website is a black box—they know it exists, but they have no idea what’s happening inside.
Google Analytics changes that. It’s a free tool that shows you exactly how people find and use your website. And while it might look intimidating at first, you don’t need to understand everything—just a handful of key reports that tell you what’s working and what isn’t.
This guide introduces you to Google Analytics 4 (GA4), the current version of Google’s analytics platform. We’ll skip the overwhelming technical details and focus on the specific insights that help local business owners make better decisions.
Why Website Analytics Matter for Your Business
Before diving into the how, let’s understand the why. Analytics aren’t just numbers—they’re insights that help you grow.
Making Informed Decisions
Without analytics, you’re guessing. Should you invest more in Google Ads or Facebook? Is your new website design performing better? Are visitors finding your contact information?
Analytics replace guesswork with data. When you know that 70% of your traffic comes from mobile devices, you prioritise mobile experience. When you see that visitors from Google Ads spend twice as long on your site as visitors from Facebook, you adjust your advertising budget accordingly.
Understanding Your Customers
Analytics reveal who your customers are and how they behave online. You’ll learn:
- Whether visitors are local (Western Sydney) or from elsewhere
- What devices they use to visit your site
- What pages they’re most interested in
- Where they drop off without taking action
This understanding helps you create content and experiences that resonate with your actual audience, not who you assume they are.
Measuring Marketing Effectiveness
Every dollar you spend on marketing should produce results. Analytics show you which marketing efforts drive traffic and conversions, and which ones waste money.
A Hills District business might discover that their monthly spend on Facebook Ads generates plenty of clicks but no enquiries, while their smaller investment in Google Ads produces most of their leads. That’s actionable intelligence that directly impacts your bottom line.
Getting Started with Google Analytics 4
If you don’t already have Google Analytics set up on your website, here’s how to get started.
Step 1: Create Your Google Analytics Account
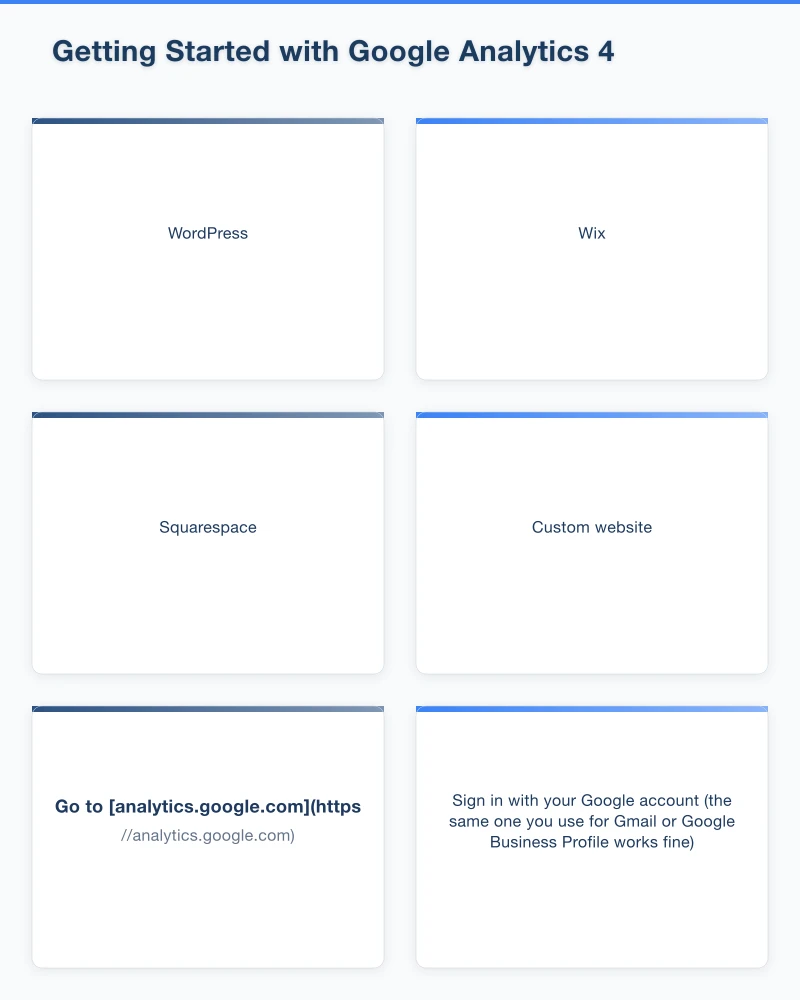
- Go to analytics.google.com
- Sign in with your Google account (the same one you use for Gmail or Google Business Profile works fine)
- Click “Start measuring”
- Enter your account name (your business name)
- Create a property (this represents your website)
- Add your website details
Google will generate a tracking code—a snippet of code that needs to be added to your website.
Step 2: Install the Tracking Code
How you add the tracking code depends on your website platform:
WordPress: Install the “Site Kit by Google” plugin. It connects your WordPress site to Google Analytics automatically, no coding required.
Wix: Go to Settings > Tracking & Analytics > New Tool > Google Analytics. Enter your tracking ID.
Squarespace: Go to Settings > Advanced > External API Keys. Paste your Google Analytics tracking ID.
Custom website: Add the tracking code to your website’s header, just before the closing </head> tag. If you have a web developer, they can do this in minutes.
Step 3: Verify It’s Working
After installation, wait 24-48 hours for data to start appearing. Then:
- Open your website in one browser window
- Open Google Analytics in another
- Go to Reports > Realtime
- You should see at least one active user (you!)
If you see activity, your tracking is working.
Understanding the Google Analytics 4 Interface
GA4 looks different from the old Universal Analytics. Here’s a quick orientation.
The Main Sections
Home: A dashboard with key metrics and insights. Useful for quick checks.
Reports: Where you’ll spend most of your time. Contains detailed data about your visitors and their behaviour.
Explore: Advanced analysis tools. Most small business owners don’t need this.
Advertising: For businesses running Google Ads. Shows how paid campaigns perform.
Configure: Settings and setup. You’ll rarely need this after initial setup.
The Key Reports
For small business owners, focus on these report sections:
Life cycle > Acquisition: Where your visitors come from Life cycle > Engagement: What visitors do on your site User > Demographics: Who your visitors are User > Tech: What devices and browsers they use
Let’s explore each of these in practical detail.
Report #1: Acquisition—Where Do Visitors Come From?
This is often the most valuable report for small business owners. It shows how people find your website.
Accessing the Report
Navigate to Reports > Life cycle > Acquisition > Traffic acquisition
Understanding Traffic Sources
You’ll see your traffic broken down by channels:
Organic Search: Visitors who found you through Google, Bing, or other search engines. These people searched for something and clicked on your website in the results.
Direct: Visitors who typed your website address directly or used a bookmark. Often includes some traffic Google can’t categorise.
Referral: Visitors who clicked a link on another website to reach yours. This includes directory listings, news mentions, and partner websites.
Paid Search: Visitors from Google Ads or other paid search advertising.
Social: Visitors from Facebook, Instagram, LinkedIn, and other social platforms.
Email: Visitors who clicked links in your email newsletters or campaigns.
What to Look For
Organic search growth: Is your SEO working? Compare this month to last month. Growing organic traffic means more people are finding you through search.
Referral sources: Which other websites send you visitors? This might reveal partnership opportunities or indicate where your business is mentioned.
Paid vs organic balance: Are you too dependent on paid advertising? A healthy mix includes significant organic traffic.
Social performance: Is your time on social media translating to website visits?
Local Business Insights
For Western Sydney businesses, pay attention to whether traffic comes from local searchers. Check if visitors from organic search are searching for terms that include your suburb or region. This indicates your local SEO is working.
Report #2: Engagement—What Do Visitors Do?
Once visitors arrive, what happens? The engagement reports reveal whether your website is working.
Pages and Screens Report
Navigate to Reports > Life cycle > Engagement > Pages and screens
This shows which pages people view most, how long they spend on each page, and how they move through your site.
Key Metrics Explained
Views: Total page views (including repeat views by the same visitor)
Users: Number of individual visitors
Views per user: Average pages viewed per visit
Average engagement time: How long visitors spend actively viewing the page
Bounce rate: The percentage of visitors who leave without taking any action (lower is generally better)
What to Look For
Most viewed pages: These are your popular content. Make sure they’re up to date and include clear calls to action.
High-bounce pages: Pages where visitors leave immediately might need improvement. Is the content relevant? Is there a clear next step?
Low-engagement pages: If visitors spend only seconds on important pages (like your services page), the content might not be resonating.
Practical Applications
A Castle Hill accountant might notice their “Services” page has high traffic but high bounce rates. This suggests visitors find the page but don’t find what they need. Perhaps the services aren’t clearly described, prices aren’t visible, or there’s no clear way to get in touch.
Compare your contact page engagement to other pages. If visitors spend good time on your site but never reach your contact page, your calls to action might need improvement.
Report #3: Demographics—Who Are Your Visitors?
Understanding your audience helps you create relevant content and target your marketing effectively.
Accessing Demographics
Navigate to Reports > User > Demographics > Overview
Note: Some demographic data requires enabling Google signals in your GA4 settings, and some data may be limited to protect user privacy.
Available Information
Country: Where visitors are located geographically
City: More specific location data (though not always precise)
Age: Age ranges of your visitors
Gender: Male/female breakdown
What to Look For
Geographic concentration: For Western Sydney businesses, are your visitors actually local? If you’re a Blacktown electrician but most traffic comes from Melbourne, something’s off.
Audience alignment: Does your visitor profile match your target customer? If you’re targeting young families but your visitors skew older, your content or marketing might be reaching the wrong people.
Report #4: Technology—How Do Visitors Access Your Site?
This report shows what devices and browsers your visitors use.
Accessing Technology Reports
Navigate to Reports > User > Tech > Overview
Why This Matters
Mobile vs Desktop: If 70% of your visitors are on mobile but your website isn’t mobile-friendly, you’re losing customers. This data justifies investment in mobile optimisation.
Browser information: If many visitors use Safari (common among iPhone users), test your website in Safari to ensure it works properly.
Device categories: Tablets, phones, and desktops all display websites differently. Know where your visitors come from.
Local Context
Western Sydney commuters often browse on mobile during train or bus journeys. If you’re a local service business, expect significant mobile traffic and ensure your website works well on smaller screens with potentially slower connections.
Setting Up Basic Goals and Conversions
The most valuable analytics measure not just visits, but meaningful actions. In GA4, these are called “conversions.”
Common Conversions for Small Businesses
- Form submissions (enquiries, quote requests)
- Phone number clicks
- Email link clicks
- Product purchases
- Booking completions
Setting Up Conversions
GA4 automatically tracks some events. To mark them as conversions:
- Go to Configure > Events
- Find events like “form_submit” or “click”
- Toggle the “Mark as conversion” switch
For more specific tracking (like tracking when someone completes your contact form), you may need to set up custom events. This usually requires some technical knowledge or help from your web developer.
Why Conversions Matter
Traffic alone doesn’t pay the bills. Conversions do. A website with 100 visitors and 10 enquiries is more valuable than one with 1,000 visitors and 2 enquiries.
Track conversions to understand:
- Which traffic sources produce actual leads (not just visits)
- Which pages lead to enquiries
- Whether website changes improve or hurt results
Creating a Monthly Analytics Routine
Analytics are only useful if you actually look at them. Establish a simple monthly routine:
Monthly Analytics Check (30 minutes)
Traffic overview:
- Total visitors this month vs last month
- Trend direction (growing, steady, declining)
Source check:
- Where is traffic coming from?
- Any significant changes in traffic sources?
Top pages:
- What content is performing well?
- Any pages with concerning bounce rates?
Conversions (if set up):
- How many enquiries/leads this month?
- Conversion rate trend
Device check:
- Mobile vs desktop split
- Any issues to address?
Red Flags to Watch For
- Sudden traffic drops (might indicate technical problems)
- High bounce rates on key pages (content or UX issues)
- Traffic from wrong geographic locations (targeting problems)
- Conversions declining while traffic grows (website effectiveness declining)
Common Questions from Small Business Owners
Q: How many visitors should my website get? A: There’s no universal number. Focus on trends (is traffic growing?) and quality (are visitors becoming customers?). A local tradie might get 500 visitors monthly; an e-commerce site might need 10,000. What matters is whether those visitors convert.
Q: Why doesn’t my analytics data match my web host’s data? A: Different systems measure differently. Analytics uses JavaScript tracking that ad blockers can prevent. Focus on trends rather than absolute numbers.
Q: How long until I see meaningful data? A: You’ll need at least a month of data to see meaningful patterns. Three months gives you better trend visibility. Be patient with new websites.
Q: Should I hire someone to manage analytics? A: For most small businesses, monthly self-monitoring is sufficient. Consider professional help if you’re spending significantly on marketing and need detailed attribution analysis.
Taking Action on Your Data
Data without action is useless. Here’s how to turn insights into improvements:
If organic traffic is low: Invest in SEO and content marketing If bounce rates are high: Improve page content and load speed If mobile experience is poor: Prioritise mobile optimisation If conversions are low: Improve calls to action and contact options If local traffic is low: Focus on local SEO and Google Business Profile
Your Analytics Action Plan
This week: Set up Google Analytics if you haven’t already Next week: Explore the main reports and understand your current baseline This month: Set up at least one conversion goal Ongoing: Monthly analytics review, 30 minutes maximum
Analytics might seem overwhelming at first, but focus on the basics. Traffic, sources, popular pages, and conversions tell you most of what you need to know. As you get comfortable, you can explore deeper insights.
Your website is working for you 24/7. Analytics help you understand exactly how well it’s performing and where you can improve.
Need help setting up Google Analytics or understanding your data? Cosmos Web Technologies offers analytics setup and training for Western Sydney businesses.
Your website’s performance depends on what’s behind it. Cloud Geeks provides the managed hosting, cloud, and IT support that keeps Australian SMBs online and secure.
Ash Ganda covers how Australian SMBs are using AI, automation, and digital strategy to grow without scaling costs proportionally.
If your business is also planning a customer-facing iOS or Android app — Awesome Apps builds cross-platform mobile apps for Australian SMBs.
Part of the Ganda Tech Services family, Cosmos Web Tech delivers specialist web design and digital marketing for Australian small and medium businesses.